First we look at the time when property prices bust elsewhere. In US recently it happened: the property prices busted like nine pins in December 2007 – June 2009.
The Great Recession: December 2007–June 2009
- Duration: Eighteen months
- GDP decline: 4.3%
- Peak unemployment rate: 9.5%
- Reasons and causes: The nationwide downturn in U.S. housing prices triggered a global financial crisis, a bear market in stocks that had the S&P 500 down 57% at the lows, and the worst economic downturn since the recession of 1937-38.41 Global investment flows into the U.S. had kept market rates low, likely encouraging unscrupulous mortgage underwriting and mortgage-backed securities marketing practices. Oil prices spiked to record highs by mid-2008 and then crashed, depressing the U.S. oil industry.
It was triggered by a large decline in US home prices after the collapse of a housing bubble, leading to mortgage delinquencies, foreclosures, and the devaluation of housing-related securities. Declines in residential investment preceded the Great Recession and were followed by reductions in household spending and then business investment. Spending reductions were more significant in areas with a combination of high household debt and larger housing price declines.
The housing bubble preceding the crisis was financed with mortgage-backed securities (MBSes) and collateralized debt obligations (CDOs), which initially offered higher interest rates (i.e. better returns) than government securities, along with attractive risk ratings from rating agencies. While elements of the crisis first became more visible during 2007, several major financial institutions collapsed in September 2008, with significant disruption in the flow of credit to businesses and consumers and the onset of a severe global recession.
There was global Price bust
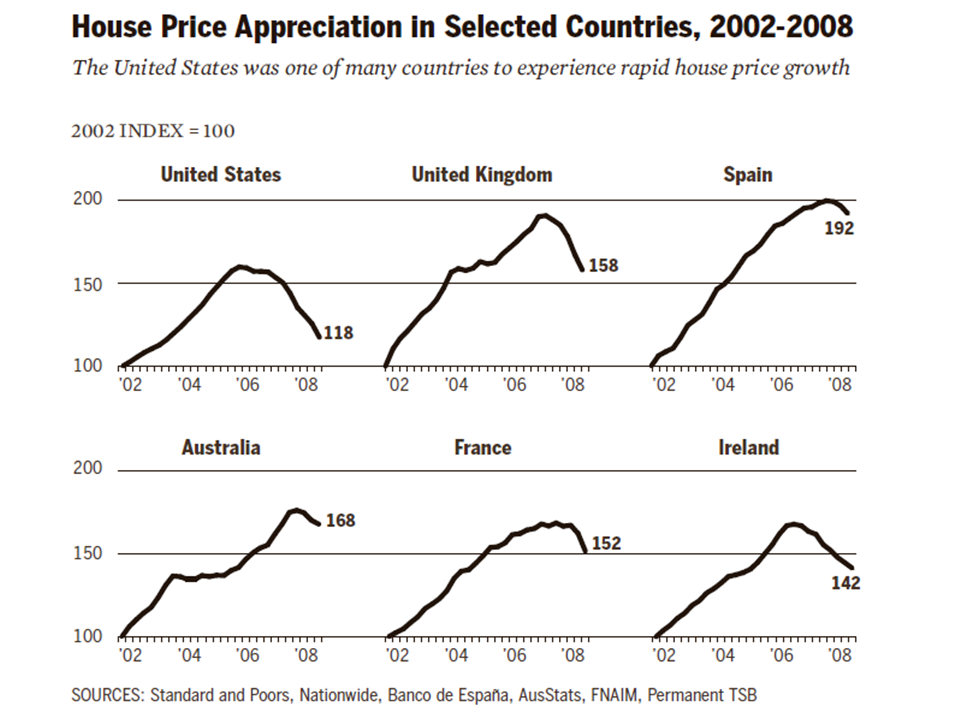
Please look at the above chart – you can see large decline in USA in house prices index from 160 to 118 in a matter of months in 2007-2008. But look at Australia, the world wide bust of property didnt come to Australia so far.
Many analysts were arguing that Australian property prices have no subprime problem. Let us look at a chart about subprime first to understand what happened then in USA
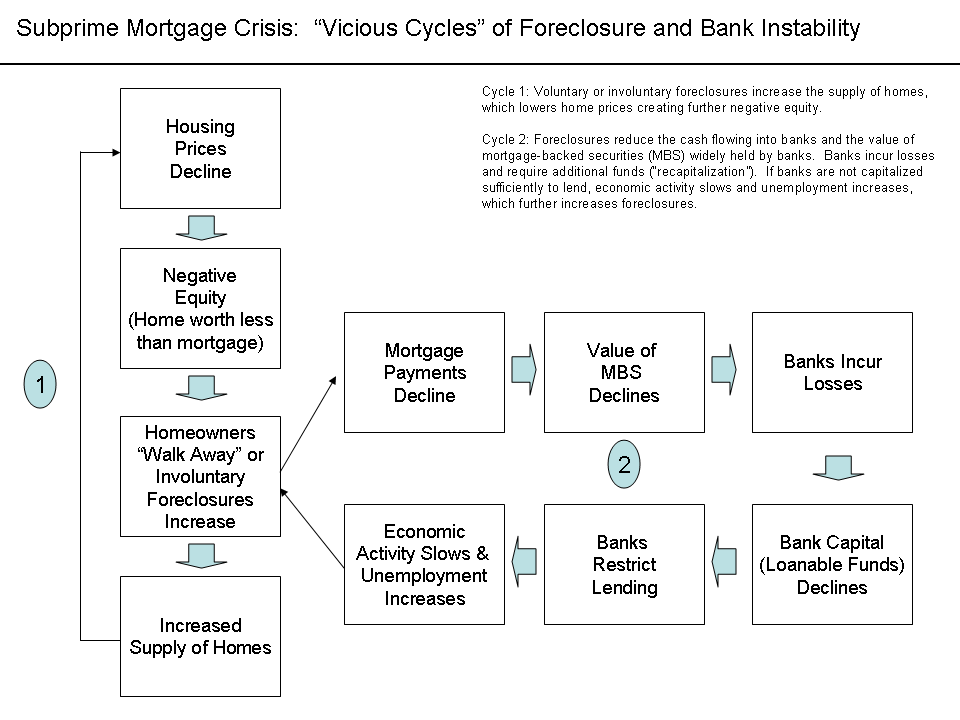
Is there a Subprime situation in Australia now?
Mimicking the above vicious cycle to Australian property market in 2022 we need to find answers to the following few preliminary questions. 1. Can Australian property prices in 2022 fall as much to trigger the chain. 2. Do negative equity properties will be on the increase in few months to trigger the chain 3. In the next few months Can Home owners walk away or involuntary foreclosures will increase substantially? 4. will there be increased supply of homes because of foreclosures and any other factors?
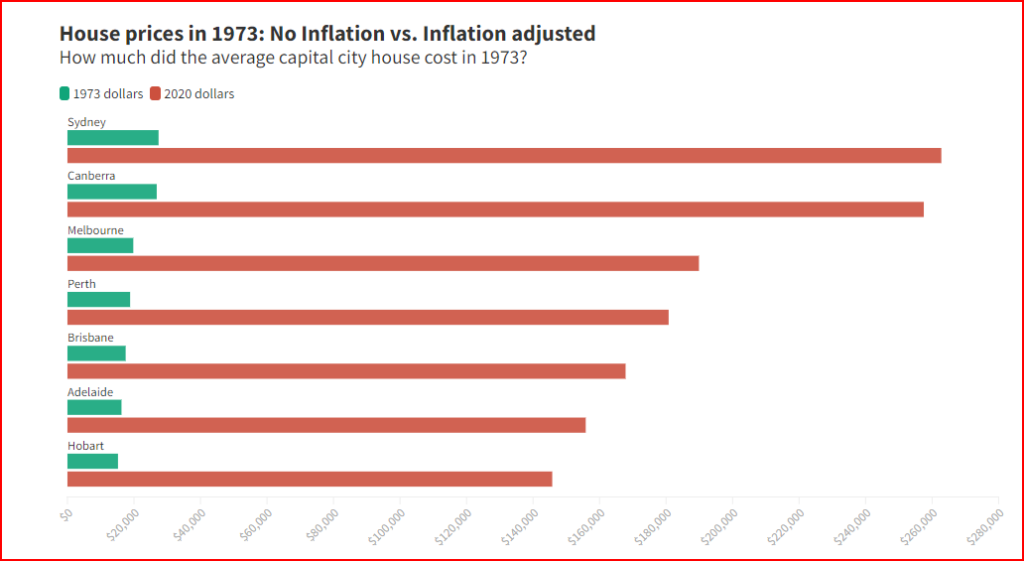
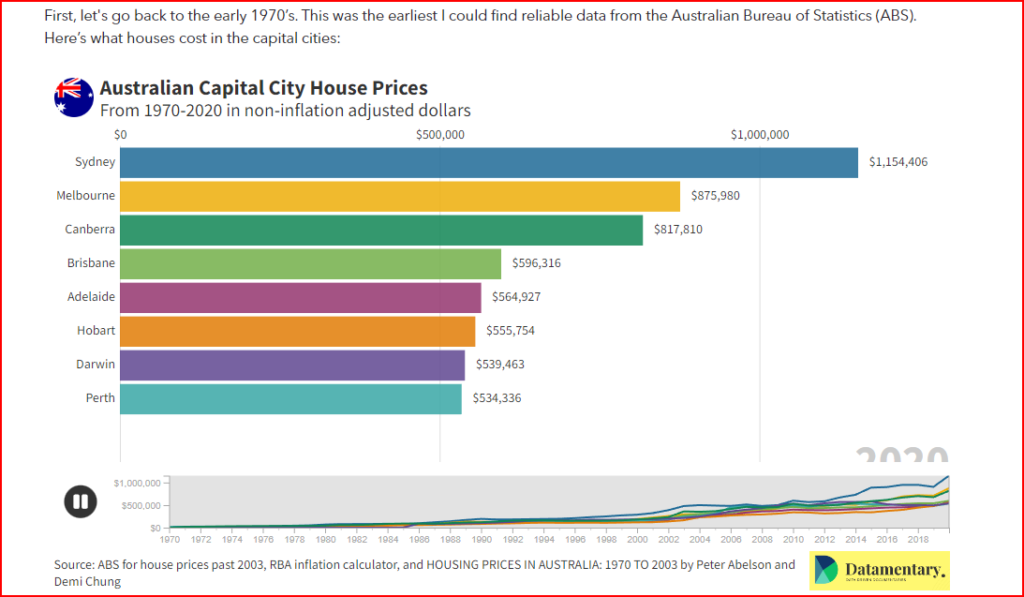
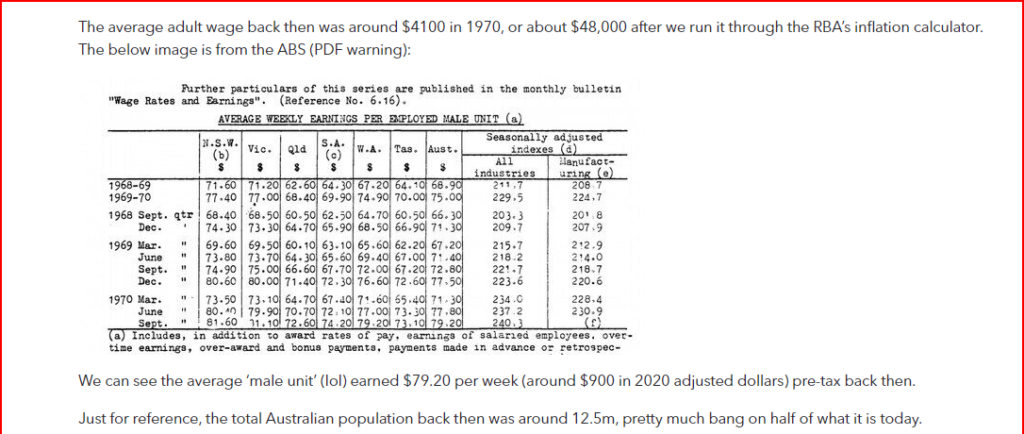
Before that we look at Australian property market and the historic prices. We go back to history and see what was the price for properties in major cities in 1970 that is compared to now in 2020 This was the earliest reliable data from the Australian Bureau of Statistics (ABS). Here’s what houses cost in the capital cities:
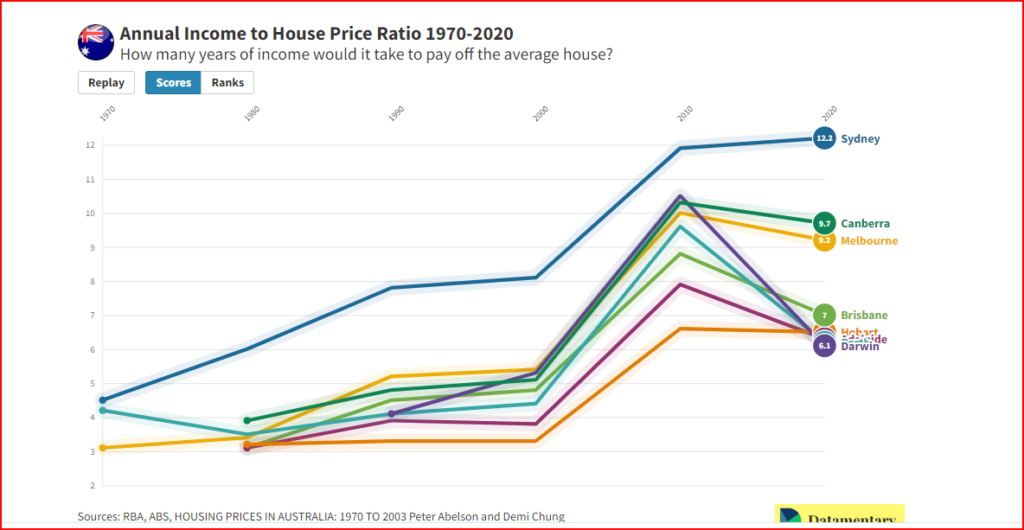
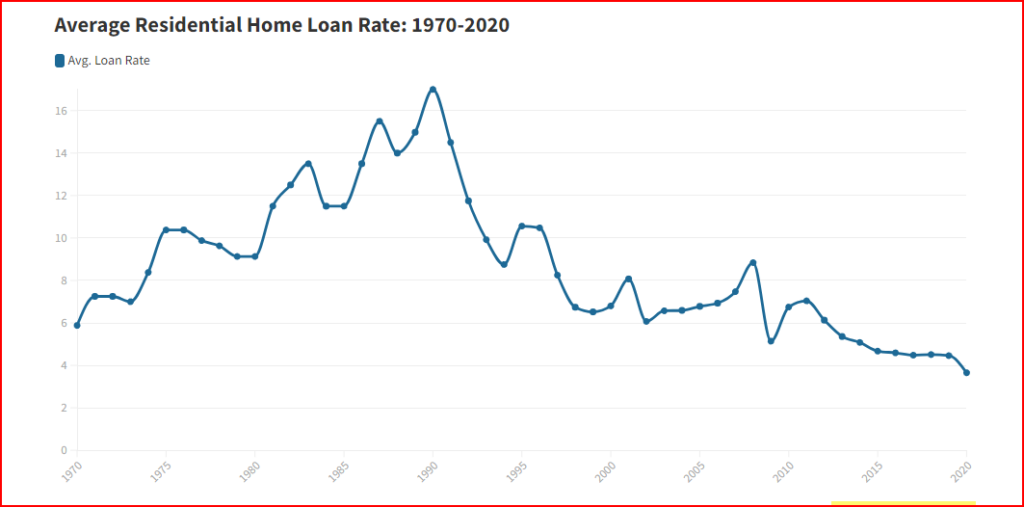
The above chart shows that a house in Sydney has increased to 12.2 times annual income. A house in Sydney was priced on a median of 4.5 times of annual income in 1970s. Also let us look at the interest rates at that time. The following chart shows interest rates were around 6 to 7 % during 1970-1973
Another factor is servicing the mortgage lets look at different periods
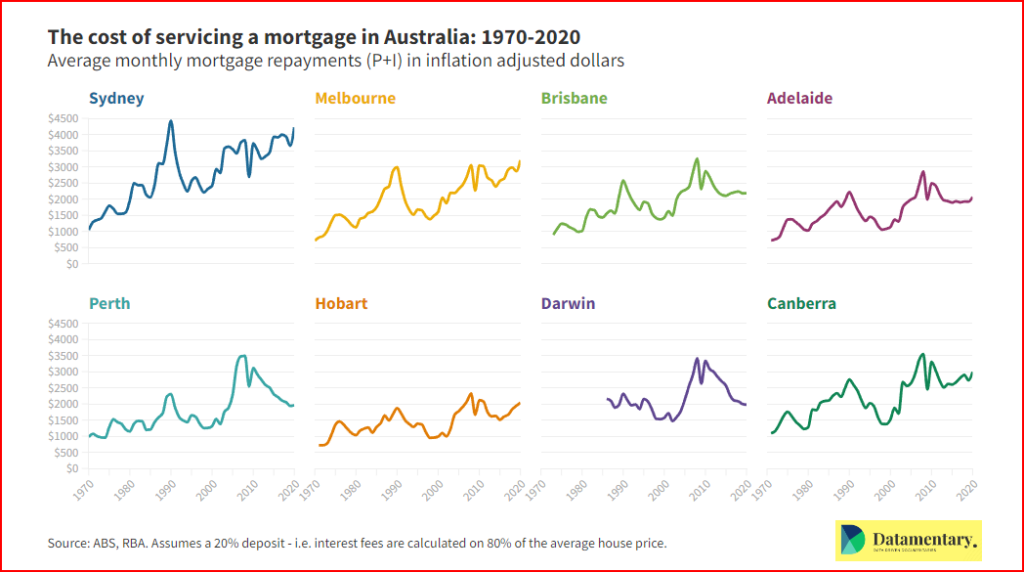
We can see from the above chart that in Sydney servicing the mortgage per month(Principal plus Interest) at an interest rate around 6 – 7 percent was around $1000 mark(in inflation adjusted monthly wage of – now it is $4500 mark – and with more interest hikes may go up to $6000.
Things are looking significantly less affordable than they were in 1970, but in most cases we’re not actually at peak un-affordability when it comes to servicing a mortgage. Although house prices in all cities are at or near historical highs, interest rates are at all time lows. For Sydney, peak mortgage pain came in 1990 when average home loan rates peaked at about 17% and one was paying $4400 / month in 2020 dollars towards his/her mortgage.
So with all the above in mind, what can we actually infer from the data? I think it’s fairly safe to make a few pronouncements.
- In inflation adjusted dollars, house prices are at or near all time highs. In 1970, an average house in Sydney cost around 20% of what an average house costs today. In other words, the ~$1.1m sale price of an average Sydney house today would buy you roughly 5.2 houses back in 1970. The trend is similar, though often not as significant, in all capital cities.
- The trend is similar if we look at average annual income as a proportion of average house prices. In 1970, the average Sydney house cost 4.5 times average pre-tax income. In 2020 it was 12.2 pre-tax income.
- Even though house prices are at or near all time highs, in pretty much all cities, mortgage payments are NOT at record highs. The reason is that interest rates are unprecedentedly low. If house prices continue to grow, or interest rates go up again, mortgage payments are likely to become unsustainable, particularly in Sydney.
- Population growth doesn’t seem to account for the increase. For example, Sydney’s population has grown by 70% in the last 50 years and its average house price has increased by 520% after accounting for inflation. Perth, on the other hand, has seen a population growth of roughly 300%, but its house prices have only increased by 260%.
I have big concern about point number 2 house price has gone from 4.5 times average pre-tax income in 1970 to 12.2 times pre-tax income in 2020 and also point number 1 where same inflation adjusted dollars of 1970s would have bought 5.2 houses compared to 2020. I am checking if it was because of demand supply – based on point 4 population increase is only 70% while property price increase is a huge 520% in Sydney. So the normal demand supply attributed to population increase would have taken house prices only to 170% and not 520%. Most analysts attribute this fact to INVESTOR activity, rather than home owner buying.
What about lending norms? The Australian financial institutional practices were thoroughly exposed at the Royal Commission. As per its recommendation -APRA lending standards addressed the lending norms. While Prudential measures created restrictions on the credit market – to reduce systematic risk – on the other hand, they gave greater market power for financial institutions. We see the RBA near zero rates in the past few years created the lowest interest rates in history, so the effects of prudential standards are still NOT TESTED in standard interest rate regimes. That makes us cross our fingers about delinquency rates on raising interest regimes and the resultant bank losses and failures. The banks might have assessed mortgage loan applications on 1 or 2 or more percent above existing mortgage rates to qualify for a loan. But they must not have weighed in sharp interest rate hikes like Federal Reserve in USA and RBA are announcing. No one is sure about what percentage increase in mortgage rates will trigger the chain of failure of mortgage payment. The banks are also in unknown waters about many once in decades current happenings. Before taking a look at how the current happenings will affect real estate we just look at some real estate key factors:
There are a number of factors that impact real estate prices, availability, and investment potential.
KEY TAKEAWAYS
- Demographics provide information on the age, income, and regional preferences of actual or potential buyers, what percentage of buyers are retirees, and what percentage might buy a vacation or second home.
- Interest rates impact the price and demand of real estate—lower rates bring in more buyers, reflecting the lower cost of getting a mortgage, but also expand the demand for real estate, which can then drive up prices.
- Real estate prices often follow the cycles of the economy, but investors can mitigate this risk by buying REITs or other diversified holdings that are either not tied to economic cycles or that can withstand downturns.
- Government policies and legislation, including tax incentives, deductions, and subsidies can boost or hinder demand for real estate.
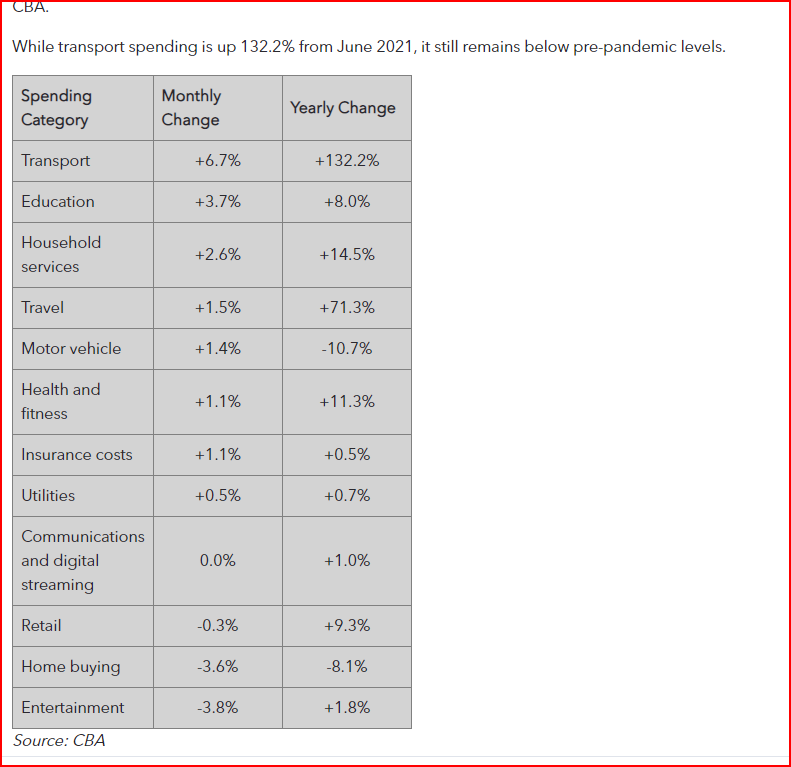
- Cost of living and house hold spending